RELI/ENGL 39, Fall 2015, University of the Pacific

Tag: Digital Humanities

DH: Spacial History

Jenna Hammerich’s “Humanities Gone Spacial” talks about the possibility of historically accurate visualizations through GIS data collection. This means that in the future through GIS map data we will be able to accurately recreate what a day was like in the past. I have some connection to GIS data collection via my brother as well as my engineering friend. My brother would tell me about how he would spend days in the field mapping out changes to the telephone poles on the Big Island of Hawaii. He would then have other people use this information to adjust the CAD (computer assisted design) maps so that they now represented the up-to-date information. One of my engineering friends is working on the Stockton levees. He has to go around and track changes in the water levels as well as anything the homeowners may have done to the levees in the past couple years (the data collection has been neglected over the years due to city budget). He told me about how someone had build a basketball court on the levee which is a huge hazard that cannot be overlooked. If the water levels were to rise significantly in the near future it is likely that the levees would not hold and Stockton would flood due to a lack of knowledge. GIS data is very time consuming to collect due to the fact that humans need to actually go to sights to assess and record the changes/status of the land. Yes, using this information to recreate historically accurate scenes would be great and would most likely be the best resource for archiving events but getting around the expense as well as time it takes to collect this data is going to be a difficult problem to overcome. Recreating historical events with such accuracy is something to strive for but not very realist, I do however hope that this does become reality. I personally struggle to visualize this when only given a text description. For people like me grasping the scale of things is quite difficult when not given anything to visually compare it to. I do like the concept of Spacial History but the problems associated with data collection and manpower shortages make me skeptical about a timely integration into our daily lives.

-Dylan

DH: Palladio Maps

palladio map 1

Map 1 & process:

The Map above was made in “Palladio” using the “Cushman-Collection” data set. I did need to clean the data set a little in order for Palladio to read it correctly. Palladio would not recognize the way the Cushman-Collection’s dates were formatted. The Cushman-Collection added a time stamp in the data “T00:00:00Z” and Palladio would not recognize it as a yyyy/dd/mm date. After going into the data and getting rid of all the time stamps Palladio can not recognize the dates and can create a map. After loading in the data I went to the maps tab and inserted a layer. There I went to Places and selected Geo-coordinates, and selected a color. Then I went to the Tiles tab and selected a map layout. After creating the map I went to timeline and selected a time interval. This time interval makes  the map show only pictures taken within that period. Using this tool can help make the map more useful at a glace because it won’t be as cluttered. The above map has a terrain background/Tile and the red point on the map show photographs taken between 1946 and 1952.

Map 2:

The map bellow was also made in “Palladio” using the Cushman-Collection data set. The map has a satellite background and the blue points on the map show photographs taken from 1952 onward (till the end date of the collection).

Palladio map 2

Limitations of Palladio:

These maps highlight the relative location of where these photographs were taken but the map does not show state boundaries. When highlighting the dots you can see the state and city that the certain picture was taken but you can only see this when viewing the map in the site. We are not able to see the picture when highlighting the dots only the URL. So creating a really customized map with this tool is quite hard. Editing the data for the site was not very difficult but utilizing the data to create an effective map is a little difficult. Not being able to embed the maps created by Palladio limits the usefulness of this tool. I think Palladio gets a lot of it’s usefulness from being able to interact with the map and not just look at it.

Useful visual tools or Palladio:

I think Palladio can create an effective map when the using the point to point option along with the size points tool. The point to point tool can show relationships between different points on the map using lines to connect them. The size points tool enlarges the dots on maps depending on the quantity of photographs at a certain location. This visual could be very useful as a visual tool as long as you don’t clutter too many points together. The tiles “Street” and “Satellite” are useful when looking at one specific point, unfortunately I was not able to have both those up at the same time which could be very useful depending on what your data is.

Spacial History:

In terms of Spacial history I don’t think that Palladio would be a useful tool because if you are not able to interact with the map you just have a picture. Not being able to see what the map is showing without a written explanation does not help show the viewer anything new.

DH: Google Fusion Table

http://www.google.com/fusiontables/DataSource?docid=1-mtFTLEeVHrE9FZq_8r7Gftng8zg2rMGB0KXbFMX

DH fusion tables pie chart

This is a pie chart summarizing the top 10 cities and states represented by photos from the the Cushman-Collection. (Cushman-Collection) The pie chart shows the percentage of photos that come from each of the 10 cities and states. To make the chart more useful from a glance I limited my categories to just 10 making this representation limited. Fusion tables allows up to 100 categories to be represented but going more than 10 for this particular pie chart would eliminate most of the percentage number on the image making it very hard to interpret without further investigation.

-Dylan


Digital Humanities: Experimenting With Palladio II- Network Analysis

Continuing our work with Palladio, we are using another one of its features, the “graph” portion of the tool. This graphing is a network analysis of the data we are using, and networks are described by Scott Weingart simply as “Stuff and relationships” in his post Demystifying Networks. The data used for this experiment was Marten Durer’s Sample Data for Network Extraction, which looks at both the relationships of some people who assisted each other during the Holocaust, and the attributes of those people including their sex and racial status.

Palladio Network 1

My first network analysis visualization shows the relationship between “givers” and “recipients” and I scaled the nodes of the recipients to show the volume of people who have helped them.

Palladio Network 2

My second network analysis shows the relationship between people’s “date of first meeting” and “date of activity”. With the limitations of Palladio, I couldn’t display the results I would have liked, particularly due to the fact that Palladio does not show directional relationships, for example here I would have shown which days people met that led to people being helped.

DH: Network Visualization

Using Palladio I was able to create the following network visualization.

giver-recipient

The visualization was created with the “Programming Historian” data set. After uploading the two tables and telling Palladio what kind of information was given I was able to go to the graphs tab create this visualization. The visualization is about who gave and received help based on the data set. the darker filled in bubbles are the recipients, Ralph Neumann is the large central node so the visualization is telling us that he received the most help.

giver-recipient-timespan

The above visualization again shows the relationship between giver and recipient this time the darker dots being the giver. I used the timespan tool to filter my results to only show instances of help that fell between time step 12 and time step 13. This tool does illustrate the data from the data set and Network visualization can illustrate almost any data set.

Although Network visualization can be used it can also lead to problems like misrepresentation of data and creating links that may not actually exist in the data. Scott Weingart mentions the creation of relationships that are not there if the user of Network visualization is not careful. Misrepresentation of data, an example being my second image. Without prior knowledge that the visualization was filtered by date you may think that it represented the whole data set. You may have even thought it represented everything in the given time step interval, when in reality I zoomed in and cut off some of the other relationships from the visualization. Bellow is what all the relationships in the interval actually look like.giver-recipient-timespan2

I do think that Network Visualization is a great tool as long as you know what relationship you wish to show from your data and you know that the relationship actually exists.

Sources:

Scott Weingart, “Demystifying Networks” http://www.scottbot.net/HIAL/?p=6279

dataset:https://docs.google.com/spreadsheets/d/1LzbWsG73m74t3p6xE7lutfVWuOdzOIfN55FbhCCRZvk/edit?pli=1#gid=77820913

Palladio: http://palladio.designhumanities.org/

Embedding a Google Fusion Map or Chart

To embed your Google Fusion map or chart into a website:

  • In Google Fusion Tables, click on the tab of the chart/map you want to embed
  • In the menu:  Tools > Publish
  • In the window that opens, be sure to change visibility to Public
  • Adjust the size of your map or chart to whatever you want it to be
  • Copy the HTML
  • Go to your web page or blog post (click on the “Text” tab of your blog post if it’s a blog) and paste the HTML

Mapping Data

Genre 1 Genre 2

Both of these maps are made with data of the Cushman Collection from Indiana University. The Data set is of the locations of Cushman paintings from all across the United States. The first map was map was made in Palladio which shows a locations of each painting. They have general locations, which doesn’t really show any specificity. While the second map uploaded was made using google fusion tables. It shows the same data, however, it has the distinct advantage of including the nearby major cities and it also includes the states each painting is in. Both maps were made through uploading an open CSV file to the their respective websites. It is evident that the palladio map has far less reference data inbuilt to its native settings, as compared to google fusion tables. In retrospect thinking about the readings done in Digital Humanities on Spacial History, the different types of paintings Cushman did makes more sense when seeing where they are from. As painting of a large building is more likely to be from a place where that was what he as surrounded by, while a painting of nature is far more likely from him being in a rural area.

Digital Humanities: Experimenting with Palladio

Another day, another experiment with Digital Humanities Tools. We are currently playing with Palladio, a mapping tool, once again using The Cushman Collection data set from Indiana University. The Cushman Collection data set is a comma delimited file which contains data on photographs, when and where they were taken, descriptions of each photo, and plenty of other useful information. A fun fact that everyone should know is that Palladio, as an in browser application, does not have an online storage system. If you want to keep your progress, you have to save an offline copy for yourself then load it in again. And like with all documents, be sure to save frequently in case say, your internet connection is reset and you attempt to load something new and all your work is lost. I also ran into issues of the program using up almost all the processing on my computer whenever I attempted to manipulate the map, such as add new layers, change point color, or even zoom in. Even with these quips, I was still able to get some rather nice visualizations by playing around.

Palladio Map 2

A basic map looking at the data with the “streets” filer applied, which displays state and country borders, as well as city names if you zoom in far enough.

 When comparing Palladio to Google Fusion Tables, I would have to say that Palladio wins out aesthetically, but the sheer number of times it crashed my browser and had me re-input the information and settings over and over just to capture a few screenshots makes me sad for anyone trying to do actual research with the tool. Until it is more stable, I think that Palladio needs to pull back on its features for a little while. On the other hand, Google Fusion Tables let me zoom in, out, and move the map to my hearts content without batting an eye. The no hassle stability of the map generator it was using, alongside the online saved data made me much less frustrated than I was with Palladio.

Google Fusion Map

A map displaying the same information as the one above, less attractive, but also much easier to work with.

All in all, when working with these mapping programs, I find it interesting to think of what applications they can have in the field of digital humanities. As discussed in Zephyr Frank’s Spatial History as Scholarly Practice from Between Humanities and the Digital, these sorts of maps focusing on the spatial relationship between objects and events create a distinct kind of visual that is very useful in communicating important ideas to an audience.

Maps with CartoDB and Tableau

Our unit in Intro DH right now is on mapping.  In class we’ll be working on creating maps with Palladio.  We also had a preliminary introduction to data, tables, and maps by experimenting with Google Fusion Tables.  In preparation for class, I imported a data set consisting of a list of images from the Cushman Archive into a few different tools to experiment.

Here is the map of the data in a Google Fusion map:

This is Miriam Posner’s version of the data. She downloaded the data from the Cushman archives site, restricted the dates slightly, and cleaned it up.  This data went straight into Google’s Fusion Tables as is.  The map shows the locations of the objects photographed.  One dot for every photograph.  Locations are longitude-latitude geocoordinates.

Then I tried CartoDB. I’ve never used it before, but it’s fairly user friendly for anyone willing to spend some time just playing around and seeing what works and doesn’t work.  The first thing I discovered was that CartoDB (unlike Fusion Tables) does not like geocoordinates in one field.  In the Cushman dataset, the longitude and latitude were together in one field.  But in CartoDB, longitude and latitude must be disaggregated.  So to create the following map in CartoDB I first followed the instructions in their FAQ to create separate columns for longitude and latitude.  Then I had fun playing with their map options.

This is just a plain map, but with the locations color coded by the primary genre of each photograph (direct link to CartoDB map):

This one shows the photographs over time (go to the direct link to CartoDB map, because on the embedded map below, the legend blocks the slider):

Then I decided I wanted to see if I could map based on states or cities (for example, summing the number of photographs in a certain state, and color-coding or sizing the dots on the map based on the number of photographs from that city or state).  So I used the same process to disaggregate cities and states as I used to disaggregate longitude/latitude — I just changed the field names. I noted, though, that for some reason, trying to geo-code by the city led to some incorrect locations. If you zoom out in the map below, you’ll see that some of the photographs of objects in Atlanta, Georgia, have been placed in Central Asia, in Georgia and Armenia. This map represents many efforts to clean the data through automation — simply retelling CartoDB to geocode the cities or states. Didn’t work well.

I also couldn’t figure out a good way to visualize density — the number of photographs from each state, for example. So I downloaded my new dataset from CartoDB as a csv file and then imported it into Tableau (Desktop 9.0). By dragging and dropping the “state” field onto the workspace, I quickly created a map showing all the states where photographs in the collection had been taken:
Screen Shot 2015-10-28 at 4.28.39 PM

Then I dragged and dropped Topical Subject Heading 1 (under the Dimensions list on the left in Tableau) onto my map, and I dragged and dropped the “Number of Records” Measure (under the Measures list on the left in Tableau), and I got a series of maps, one for each of the subjects listed in the TSH1 field:
Screen Shot 2015-10-28 at 4.29.29 PM

Note that Tableau kindly tells you how many entries it was unable to map!  (the ## unknown in the lower right).

Below I’ve Summed by the number of records (no genre, topical subject, etc.) for each state. For this, it’s better to use the graded color option than the stepped color option.  If you have just five steps or stages of color, it looks like most of the states have the same number of images, when it is more varied.  The graded color (used below) shows the variations better.

Screen Shot 2015-10-28 at 4.35.24 PM

This map also shows that the location information for photographs from Mexico was not interpreted properly by Tableau.  Sonora (for which there is data) is not highlighted.


Then I decided hey, why not a bubble map of locations, so here we go.  Same data as above map, but I selected a different kind of visualization (called “Packed Bubbles” in Tableau).

Screen Shot 2015-10-28 at 4.35.39 PM

When I hovered on some of the bubbles, I could easily see the messy data in Tableau.  Ciudad Juarez is one of the cities/states that got mangled during import, probably due to the accent:

Screen Shot 2015-10-28 at 4.35.56 PM

Finally, a simple map with circles corresponding to the number of photographs from that location. (Again clearly showing that the info from Mexico is not visible.  In fact, 348 items seem not to be mapped.)

Screen Shot 2015-10-28 at 4.36.33 PM

Obviously the next step would be to clean the data, using Google Refine, probably, and then reload.

Many many thanks to the Indiana University for making the Charles Cushman Photograph collection data available and so well-structured and detailed. Many thanks also to Miriam Posner for cleaning the data and providing tutorials for all of us to use!

Spatial history and mapping websites discussed in class

In addition to the websites already on the syllabus, in class I discussed the following:

Digital Humanities: Experimenting with Google Fusion Tables

In our Digital Humanities class, we worked with a comma separated values file of The Cushman Collection from Indiana University using Google Fusion Tables, the product of what I played with can be found here.

Google Fusion Tables

This is my network map comparing the “Genre 1” and “Location” subjects within the Cushman Collection.

I also played around with various other visual tools within Google Fusion Tables, including network maps of categories that don’t correlate to each other, like my map of “Description from Notebook” compared to “Topical Subject Heading”.

Something else I would like to play around with in Google Fusion Tables would be to see how I can interpret information using the “Cards” feature.

DH: Cushman exhibit

Digital Humanities, Cushman Graph

This chart displays the amount of pictures from different cities and states by a percentage of pictures uploaded. This is taking into account some are omitted as the data range of states is limited to 100 locations, while there exist many more outside of these parameters. As such the information was sorted by descending amount of photos.

All data can be found on the Charles Cushman Photography collection

http://webapp1.dlib.indiana.edu/cushman

Top Secret Vs Secret

For past few months I have been doing some (lazy) research into the, “Report of the Senate Select Committee on Intelligence Committee Study of the Central Intelligence Agency’s Detention and Interrogation Program”. Pretty much a declassified document that was made publicly available last year including details of the treatment and conditions detainees were put in under the CIA’s custody. It is a 712 page document that you can download to PDF by google-ing the title above and personally I think it is a great read. Sadly it is only 712 pages of a 6700~ document, the rest being still classified. The link at the bottom will take you to a blog, “EVERYTHING ON PAPER WILL BE USED AGAINST ME” on Quantifying Kissinger. In the video it uses a text analysis program to look over classified documents like the one I am researching. Being foolish I used AntConc to look through the text in the PDF document and it almost ruined the entire thing for me. Searching terms like inhumane or cooperative brought me to discovering the CIA’s “enhanced interrogation techniques” and even other terms too disgusting to post about when tagging my course. This document is full of things like torture, interrogation discussions, and a lot of black bars which makes me curious. In the text analysis of the classified documents in the video on Quantifying Kissinger, what did they search for? Were there language barriers in documents that were not English? How did they get around those barriers? What did they find similar about the documents researched? Personally, reading through my first declassified document is cool enough but I would find it extremely difficult translating all of the information if the program was not able to itself.


Quantifying Kissinger

Have you heard of Omeka?

Sorry for the absence recently, I was planning on posting a lot more but my apartment is having electrical issues after it rained. I think a mouse decided to bite one of my power lines because only my refrigerator is running at the moment. An electrician is suppose to be coming Thursday but he said it may be a few visits but because of the inconvenience I have moved my schedule around to have a minimum of 3 hours at the library everyday for some post class studying/blog post. I’ll be honest its hard to live without the internet and the schedule change was also influenced by the lack of Netflix.

Similar to my previous post on Archives, I am going to talk about my experience with Omeka. This past week I researched in a lot into the religion and artifacts relating to the story of Perpetua and Felicitas for the Digital Humanities course I previously posted about. I wont go into too much detail about their story but feel free to look it up! There is actually a short animated show about it if you are like me and prefer watching instead of reading, #Dyslexia. Long story short, Perpetua and Felicitas were martyrs that had a very intense and romantic tale by refusing to give up their faith. Typical religious story inspiring people to stand up for what they believe in. The class built an online exhibit that I will link at the bottom of the post with Omeka that gave us a semi user friendly format to collect the metadata and organize an online exhibit. This exercise gave me a great insight on website/exhibit design, legal online sharing, and the in depth research on religion and historical traditions. Omeka was a little difficult to use at first but after a few entries it became more familiar. The website and exhibit layout was made a lot more simple with the help of Omeka.

The experience in creating the online exhibit reminded me of many different readings but mostly got me thinking about sharing on the internet. All of the material in the exhibit was found on the internet and doing researching the copyrights on sharing or reusing that material was enlightening into how copyrights work but I think we made a great site. Between the “Setting the Stage” reading by Anne Gilliland on metadata and an earlier one on internet sharing I think back to my experience being a private investigator in training. My father was my mentor and taught me the business I want to take over in the future. With the things my dad taught me in finding people, I was able to find some pretty interesting things for the exhibit. My favorite item being the animated film and comic book about Perpetua and Felicitas. Collecting metadata to include in the exhibit personally was the hardest part because I felt as if somehow I was going to mess things up or get emailed about copyright infringement.

Along with the research I was doing for the exhibit I was doing my own research on a site I regularly visit. The title “World’s most expensive hard disk made of sapphire will last 1 million years” caught my eye and got me thinking of how it could be used for archiving purposes. The 20cm industrial sapphire disks cost about $30,000 and can hold around 40,000 miniaturized pages. Two of these disks are then molecularly fused together and all you will need to view these pages is a microscope! The concept of this is incredible that we can bury this CD somewhere and a million or even thousands of years from now people could see whatever is documented on it. One of the problems with archiving is that computing and technologies are forever evolving eventually leaving behind the programs used to read that code. This simple disk takes that one problem and throws it out the window… But it is much more expensive and only holds 40,000 pages which isn’t much in my opinion.


Link to Omeka Exhibit: Exhibit

Link to Sapphire CD article: Article

Heres a young deer discovering a ball! Video


Websites referenced today

Here are the websites we looked at today:

https://www.youtube.com/watch?v=qKzQywUeyyE

http://artport.whitney.org/commissions/thedumpster/interface.html

https://linkedjazz.org/

http://selcukartut.com/dystopia-utopia/

Digital pedagogy and student knowledge production

The past two weeks in my Introduction to Digital Humanities course, students have been using the open-source content management system Omeka to create online exhibits related to the early Christian text, the Martyrdom of Perpetua and Felicitas.

I was astounded by their accomplishments.  The students raised thoughtful questions about the text, found items online related to Perpetua and Felicitas to use/curate/re-mix, and then created thoughtful exhibits on different topics in groups.

None of them know much if anything about early Christianity. (I think one student has taken a class with me before).  None of them had used Omeka before.  Few of them would consider themselves proficient in digital technology before taking the class.

Here’s what they created.  In two weeks. And I’m super proud of them.

Here’s what we did:

  • We read and discussed the text together.
  • They all registered on our joint Omeka site, and we created a list of questions and themes that would drive our work.
  • Each student then went home and found three items online related to Perpetua and Felicitas or any of the themes and questions we brainstormed. (They watched out for the licensing of items to be sure they could reuse and republish them.)
  • In class each person added one item to the Omeka site — we talked about metadata, licensing, classfication
  • We revised revised revised; in groups, each student added two more items
  • We grouped the Items into Collections (which required discussion about *how* to group Items)
  • Then in small groups, students created Exhibits based on key themes we had been discussing.  Each group created an Exhibit; each student a page within the exhibit.

What made it work?

  • Before even starting with Omeka, we read about cultural heritage issues and digitization, licensing, metadata, and classification — all issues they had to apply when doing their work
  • Lots and lots of in class time for students to work
  • Collaboration!  Students all contributed items to Omeka, and then they each could use any other students’ items to create their exhibits; we had a much more diverse pool of resources by collaborating in this way
  • Peer evaluating: students reviewed each others work
  • The great attitude and generosity of the students — they completely submersed themselves into it.
  • The Omeka CMS forced students to think about licensing, sourcing, classification, etc., as they were adding and creating content.

The writing and documentation in these exhibits exceeded my expectations, and also exceeded what I usually see in student papers and projects.  Some of this is due to the fact that I have quite a few English majors, who are really good at writing, interpreting, documenting.   I also was pleasantly surprised by the level of insight from students who were not formally trained in early Christian history.  They connected items about suicide and noble death, as well as myths about the sacrifice of virgins; they found WWII photos of Carthage.

Are there some claims in these exhibits that I would hope someone more steeped in early Christian history would modify, nuance, frame differently?  Sure.  And not all items are as well sourced or documented as others.  We also did not as a class do a good job of conforming all of our metadata to set standards (date standards, consistent subjects according to Dublin Core or Library of Congress subject categories, etc.).  We tried, but it was a lot of data wrangling for an introductory class.  And honestly, I was satisfied that they wrestled with these issues and were as consistent as we were.

So in sum, for undergraduate work, I was pleased with the results, and am happy to share them with you.

Digital Humanities: Experimenting with Omeka

At my university, in my Digital Humanities class, we played around with the website Omeka and made an exhibit revolving around Perpetua and Felicitas, both their story and themes relating to their martyrdom. The experience can be found here: http://perpetua-felicitas.carrieschroeder.org/

Researching items for this exhibit, as was creating a page of Dublin Core metadata for each item we found. It truly gave me an appreciation for metadata, as it offers more information than works cited or bibliography pages, and is in my opinion, more accessible and informational.

In Robert Leopold’s article, Articulating Culturally Sensitive Knowledge Online: A Cherokee Case Study, he makes the case for withholding information, knowledge, and content on the basis of culturally sensitive material. While I see and understand the reasoning for why this is, I also believe that transparency, as well as the appreciation of culture, is very important in making the world a better place. Archives allow the work and information to be accounted for, retrievable in the event of the loss of the original or physical work, preserved like fossils for future generations.

I do not believe that what we did with Omeka would be possible without the sharing of information and culture, and the exhibits we presented through the site are just a flash of what this kind of archival methods can be used for. The experience we had working on this experiment was very cool, and I really like the Dublin Core standard for metadata. Being able to see how the original creator of the image below tagged their data was also rather cool to me.

Dublin Core information that I inputted can be found here: http://perpetua-felicitas.carrieschroeder.org/items/show/66

Dublin Core information that I inputted can be found here: http://perpetua-felicitas.carrieschroeder.org/items/show/66

A Martyr Is a Witness

martyr-corpus-word-cloud

Sinclair, Stéfan and Geoffrey Rockwell. “Voyant Tools: Reveal Your Texts.” Voyant. 31 Aug. 2015 <http://voyant-tools.org/>

In my Introduction to Digital Humanities course, my students are conducting very basic text analysis using Voyant and AntConc.  One of the datasets we are using is a set of martyr texts taken from the now public domain Ante-Nicene Fathers series (available at newadvent.org).

I’m a little bit of a skeptic regarding wordclouds; I generally regard them as useful insofar as they are aesthetically pleasing and in that they may spark a deeper interest in a text or set of texts.

Thus, I was pleasantly surprised to see the results of the wordcloud in Voyant.  A martyr is a witness, quite literally in Greek.  And lo and behold: the most prominent word (after accounting for a standard English stop word list) is “said.”  Speaking.  Witnessing?

We also put the martyr texts through AntConc, and we tested the Martyrdom of Perpetua and Felicitas against the rest of the dataset to check for key words: just which words were distinctive to Perpetua and Felicitas?  Once again I was pleasantly surprised.

AntConc: Keywords in Perpetua and Felicitas measured against other martyr texts in English translation

AntConc: Keywords in Perpetua and Felicitas measured against other martyr texts in English translation

Note the prominence of “I” and “my” and “me.”  The “keyness” of the first person pronouns reflect the presence of a section of the martyr text often called Perpetua’s “prison diary”; according to tradition, the diary was written by Perpetua herself.  The keyness of “she” and “her” of course reflect the text’s women protagonists.


Perpetua and Felicitas: Counter-Culture in the 3rd Century (October 5th, 2015)

This article from PBS about early Christian martyrs is an interesting one. Within, Professor Wayne A. Meeks describes what is happening with Christianity is a sort of counter-cultural movement. Now as someone who attended Catholic school for eight years, counter-culture was pretty much explained to me as that which goes against the teachings of the church. And that interested me, the perspective shift from Christianity being the counter-culture of its day, to defining counter-culture to me as that which was not them. This is likely some weird thing from my early Catholic school days, but it has always stuck with me. And I found counter-culture to be an intensely interesting subject. Maybe the martyrs did too. I do not know the specific context for this story other than what I read in the article and what I have learned from school, and I always have been bad with historical context, but I think that a lot of these martyr stories are hard to relate to our own personal context. Here in the United States we at least try to have a separation of church and state, the Roman government had no such distinction and thus had rituals embedded into their culture as something that the community does as a whole. I think a big part of historical context that escapes me, and may escape others is that the further back you go in time, individuals and small groups just become numbers that we don’t relate to. Or generalizations of a story. But this story, that of Perpetua and Felicitas (though as a child I was always told it was Felicity), focuses on two individuals and helps to reign that back in for me. It was individuals who were persecuted. Individuals who offered themselves to God by the edge of the sword. Small groups of society being persecuted interacting with other small groups of society that wanted to persecute. I think, that since the Roman government at large did not have a strict policy on the persecution of Christians that it was the small minority that banded together as a group to execute those of another faith, or at least those who did not participate in a same social manner. I think that the outliers on both sides of the story were those well documented because it wasn’t the mundanity of regular culture. Why document the regular everyday happenings of real life if everybody already knows it? The stories of the Christian martyrs, as far as I know, are documented better than the early growth and expansion of Christianity (as well as being part of that growth), and the stories continue to contribute to Christian faith to this day. The importance of their martyrdom, in my eyes, was the counter-culture idea that people believed so strongly in their faith that they would die for it. Again, I do not know the context of the time, but from what it seems like, the Roman community practicing sacrifice could just as easily have taken the same steps that some Christians did and faked their way through the offerings. They could have been weaker in their faith to their gods than the Christian martyrs had in their God. And I believe this is why Christianity drew upon martyrdom as a source of power and not tragedy, it proved their place in the pantheon of religions that existed at the time, and established them as a real participant in humanity’s dialogue with the concept of higher being(s). -Luke Bolle

4.2.7

This image of Perpetua and Felicitas also shows something that wasn’t brought up in the reading: they were also women of color.

Image Source

What are Digital Humanities?

So I am taking a class on Digital Humanities and at first look I thought it was just going to be another tech course analyzing media outlets like Facebook or movies. I soon realized this is not what the course would be like. As a student I tend to banish a healthy diet, focus on studies rather than cleaning, and concentrate on the quality of my school work. This is the culture of a hardworking student attending a small university. Now how would you digitize something like culture? Preserving our culture and traditions in the digital form to some is very important. Internet archives are one way digital humanities preserves cultures and also the people from that age. In my studies I learned a lot of interesting things through Shelley-Godwin archives or the Invisible Australians archives. Through my minimal understanding of Australian culture or history I found incredible information from these websites (link at bottom) that really surprised me. I never knew that Asian Australian’s were oppressed in such a way and on the archive they have all kinds of records that I find very interesting. I am weirdly into really old photos and this archive has plenty of them. The Shelley-Godwin Archive holds the original workings of multiple english writers. To me it’s something most high school students might despise, the original notes of Frankenstein are stored on this archive. I would really enjoy creating my own archive of college work I have done and seen how my personality and culture changed over these four years. Including all my papers, grades, notes, and other creative works I may be able to identify what I felt at the time. Maybe find out something about my writing or my college identity that I did not know about myself. All in all I would find it easier to relate to the course if I comprise a digital humanity for myself

Invisible Austrialians

Shelley-Godwin Archive

Why do people matter in the Digital Humanities?

When it comes to any study or innovation, I believe that people matter. All people, no matter their race, gender, social class, or disability. Especially in any branch of the Humanities, because the Humanities is about people and how things like art, philosophy, and history relate to people.
So, when it comes to the Digital Humanities and the creation of new technology (like computer programs) all people – of all backgrounds and various abilities – should be kept in mind. The podcast, talked about how personal computers were advertised to primarily male consumers. Thus, it is primarily men who grow up using computers, and when it comes to taking a class about computing, a man who has spent his life with a personal computer has an advantage in the classroom over a woman who understands the math behind algorithms and computing, but might not be used to using a computer. And if a teacher does not provide aid to those (primarily women) who are not used to a computer, than it is men who pass the class and women who have to struggle. In a classroom, a teacher should be ready to help everyone and should not assume that everyone is of the same level of experience.
That leads me to the Williams text, which talks about people with disabilities and other disadvantages when it comes to using technology and computer programs. I like how the text points out that computer are an assistive technology not just for people with special needs but all people. Computers make things easier for able-bodied people so the same should apply to those with disabilities. When technology is convenient for those with disabilities it is convenient for everyone. And like Williams points out, it is the right thing to do.

First foray into topic modeling

I spent two weeks at DHSI this year.  Week 2 I took Liz Losh’s and Jacque Wernimont’s Feminist DH, which was incredible and I highly recommend to everyone.  Check out the #femdh stream on Twitter for details.)

During week 3 of DHSI this year, I took Neal Audenaert’s Topic Modeling, in which we were introduced to using R and then using Mallet in R (following Matt Jockers’ book).  I decided to try to topic model the English Revised Standard Version of the Bible, because:  1) I know the material, 2) it was easy to scrape.

I used 1000 character chunks (except for the teeny tiny books like Philemon and some other epistles).  And I chose 20 topics (which was too small, but hey, this was my first time out), and Jockers’ stop list (which Neal gave us and I’m guessing is online somewhere).  First thing I noticed (besides needing more topics) was that the stop list needs to be expanded. Topic #13 below is basically junk, because of “thee”, “thy”, etc. Thanks to Neal for the help this week!

Here are wordclouds of the top 100 words in each topic. Some make a lot of sense.

1. 1.moses-rsvbible
2. 2.earth-rsvbible
3. 3.offering-rsvbible
4. 4.jews-jesus-rsvbible
5. 5.jesus-disciples-biblersv
6. 6.king-rsvbible
7. 7.god-christ-faith-rsvbible
8. 8.behold-rsvbible 9. 9.david-rsvbible
10. 10.lord-israel-rsvbible
11. 11.father-rsvbible
12. 12.city-house-rsvbible
13. 13.thou-thy-rsvbible
14. 14.tribe-rsvbible
15. 15.woman-man-wife-rsvbible
16. 16.house-solomon-rsvbible
17. 17.gold-rsvbible
18. 18.sons-rsvbible
19. 19.land-rsvbible
20. 20.wicked-righteous-rsvbible

My digital future

This fall, as I have been trying to finish up my book project, Monks and Their Children, I have been asked more than once:  What’s your next project?   When I start describing copticscriptorium.org, I frequently get the reply:  no, I mean your real project, your next book.  My internal response was always twofold:  the snarky, “What, bringing the study of an entire language into the 21st century is not enough?” and the desperate, “I am not sure I have another monograph in me.”  And as the fall wore on, and 2014 became 2015, I became more and more convinced of the authenticity of those sentiments:  that digital scholarship in early Christian studies and late antiquity is still not regarded as legitimate as print monographs and articles, and that indeed I had no interest in writing another monograph.  It’s not that I thought I couldn’t write another book, but that I just had no desire to spend another decade on a long-form argument.  I was more interested in digital writing and digital scholarship that could be read or used by a community more quickly.  And in tighter, more focused arguments in essay form.

I also began chafing more and more at the conservatism of the field.  The definitions of “real” scholarship, the structural sexism that colleagues like Ellen Muehlberger and Kelly Baker were documenting in academia, and the perception of Egypt and Coptic as marginal areas of study.  That conservatism stoked my rebellious fires further; I was not going to force myself to come up with a book project just because that was what one “did” as an active scholar.

And then I saw the CFP for the Debates in the Digital Humanities Series.  It’s a call for essays, not monographs, but like Augustine hearing the child chant, “Tolle lege,” I had an epiphany:  I damn well had a third book in me. I just hadn’t put the pieces together.

In fact, I have two projects in mind:  both are examinations of the field of early Christianity as it intersects (or does not) with Digital Humanities.  Both are political and historiographical.

The book (as yet untitled) is about early Christian studies (especially Coptic and other “Eastern” traditions and manuscript collections), cultural heritage, and digitization.  Planned chapters are:

  1. Digitizing the Dead and Dismembered.  About the material legacy of the colonial dismemberment of archives, the limitations of existing DH standards and technologies (e.g., the TEI, Unicode characterset, etc.) to account for these archives, and how these standards, technologies, practices must transform.  The Coptic language and the White Monastery/Monastery of Shenoute manuscript repository will be the primary source examples, but there should be other examples from Syriac, Arabic.
  2. Can the Colonial Archive Speak? Orientalist Nostalgia, Technological Utopianism, and the Limits of the Digital.  This chapter will look at the practice of constructing digital editions and digital libraries and (building on the issues discussed in the previous chapter) explore the premise that digitization can “recover” an original dismembered archive such as the White Monastery’s repository.  To what extent can digitization recover and reconstruct lost libraries?  What are the political and ethical obligations of Western libraries to digitize manuscripts from Egypt and the wider Middle East?  Does digitization transcend or reify colonial archaeological and archival practices?  This chapter focuses on the concepts of the archive and library and voice.  [HT to Andrew Jacobs for inspiring the chapter title.]
  3. Ownership, Open Access, and Orientalism.  About the benefits, consequences, and dangers of the open access paradigm for digitizing eastern Christian manuscript collections.  Will look at the history of theft of physical text object from monasteries by Western scholars and will ask whether open access digitization is cultural repatriation or digital colonization.  Will look at a number of complexities:  a) the layers and levels of digitization (metadata, text, images); b) the spectrum of openness and privacy possible; and c) the different constituencies involved in asking the question:  whose heritage is this?  who owns/owned the text?  Church, local monastery, “the world” (as world heritage), American/European scholars who have privileged access to some of these texts already in their libraries or on their computers. Will explicitly draw on insights from indigenous cultural heritage studies related to digitization and digital repatriation.
  4. Transparency and Overexposure:  Digital Media and Online Scholarship in Debates about Artifact Provenance.  This chapter will examine the extent to which blogs and social media have changed the conversation about the provenance of text-bearing objects we study, and the ethical responsibilities of researchers.  Will also look at the risks of online debates, and suggest ways to have constructive conversations moving forward.  With special attention to the intersections of status (who’s online and who’s not?) and gender.
  5. The Digital Humanities as Cultural Capital: Implications for Biblical and Religious Studies.  Why our field needs to stop treating digital scholarship as derivative or less rigorous, the implications for us being so conservative about digital scholarship as a field, and how Biblical and Religious Studies can contribute to DH as a discipline (not just in content but in concept, in theory, in its very understanding of itself as a discipline or field, in other words, why DH needs Biblical and Religious studies).
  6. Desirable but maybe a stretch:  War and the Western Savior Complex:  Looks at the rhetoric of crisis and loss (especially in the context of the early 21st c. wars and revolutions in the Middle East) around saving texts, artifacts, and traditions.  What does it mean for scholars from Europe and America who are not the policy makers in their countries but are nonetheless citizens of them to be making pleas for the preservation of antiquities and or cultural traditions (and there is —see Johnson’s JAAR article “‘He Made the Dry Bones Live'”— a conflation of ancient traditions and modern Eastern Christian peoples in scholarship and the media)  that are endangered in part because of the actions of our governments?

The other project will be digital historiography:  using digital and computational methods to crunch Journal of Early Christian Studies (and hopefully its precursor the Second Century?) to look at trends in the field, especially with respect to gender.  Who is publishing, what are we publishing on?  Who is citing whom?  Who is reviewing whom?  How has that changed (or not) over the decades?  This may be one or two essays, not a book.  And it is inspired in part by Ellen Muehlberger’s work micro-blogging statistics on gender in biblical studies book reviews.  I’m taking the Topic Modeling course at DHSI this summer and will think more how that or other methods (concordance text analysis, network analysis, etc.) will support this project.

I hope to publish all of this in digital form, including the monograph on cultural heritage and cultural capital.

So that’s my digital future.  Of course, first I need to get a couple of other things out the door.  And of course Coptic Scriptorium continues.  But when you ask me what my next book is about, there you go.

Creative Commons License
This work is licensed under a Creative Commons Attribution-NonCommercial-NoDerivatives 4.0 International License.

Fall 2014 release: more texts, more standardization

We’ve got a new release of material at www.copticscriptorium.org.

New stuff:

Additional texts:

  • more Sayings from the Coptic Apophthegmata Patrum
  • chapters of 1 Corinthians
  • additional chapters of the Gospel of Mark

Updated and corrected annotations (part of speech, language of origin) in previous corpora

Standardized field names for annotations and metadata across the corpora

Linguistic analysis views for all texts that have translations: aligned Coptic, part of speech tag, and translation in easy-to-read HTML visualizations:

Screen Shot 2014-11-03 at 10.43.23 PM

From Abraham Our Father, selection from codex YA, pp. 525-30 

On our acknowledgments page, each contributor has links to queries for their material in ANNIS

Coming very soon (hopefully in the next week):
blog posts about the texts, tools, and data models
updated TEI XML files of the corpora

Later in 2014 and early 2015:
Shenoute’s Not Because A Fox Barks
More Biblical material, including Greek alignment with the SBL Greek New Testament

Please let us know if you’re interested in contributing to the project! Have Coptic texts you’d like to put in the ANNIS search and visualization tool? Want to annotate any of the documents for biblical references, or something else?  Reply to this post or email C. Schroeder carrie [at] carrieschroeder [dot] com

Also: Let us know if you find any errors. We’ll show you how to fork us on GitHub and edit our data!

Digitizing the Dead and Dismembered: Presentation at DH2014 in Lausanne

We’ll be presenting at DH2014 in Lausanne, Switzerland, on July 10, 2014.

“Digitizing the Dead and Dismembered: DH Technologies for the Study of Coptic Texts”

The abstract is below (and at the DH2014 site).

Here are the slides:

You can also download them as a pdf.

Printed abstract:

Digitizing the Dead and Dismembered: DH Technologies for the Study of Coptic Texts

  • Schroeder,Caroline T.
    University of the Pacific
    carrie@carrieschroeder.com
  • Zeldes,Amir
    Humboldt University
    amir.zeldes@rz.hu-berlin.de
Abstract

This paper will explain the unique challenges to processing and annotating the Coptic language for digital research and present solutions and methodologies for digital linguistic and historical scholarship.

The Coptic language evolved from the language of the hieroglyphs of the pharaonic era and represents the last phase of the Egyptian language.  It is pivotal for a wide range of humanistic disciplines, such as linguistics, biblical studies, the history of Christianity, Egyptology, and ancient history.  Whereas languages like Classical Greek and Latin have enjoyed advances made in digital humanities with fully-fledged online research environments accessible to students and scholars (such as the Perseus Digital Library), until recently, no computational tools for Coptic have existed. Nor has an open digital research corpus been available.  The research team developing Coptic SCRIPTORIUM (Sahidic Corpus Research: Internet Platform for Interdisciplinary multilayerMethods) is developing and providing open-source technologies and methodologies for interdisciplinary research across multiple disciplines in the Coptic language.  This paper will address the automated tools we are developing for annotating and conducting research on a Coptic digital corpus.

Conducting digitally-assisted and computational research in Coptic using available DH resources is complex for several reasons.  Most texts are preserved from damaged, incomplete, and dismembered manuscripts or papyri.  The DH project papyri.info has begun to create an online open-access resource for the study of Greek papyri and is beginning to digitize Coptic papyri and ostraca (ancient pot-shards with writing).  These texts, however, are primarily documentary, consisting of wills, contracts, personal letters, etc.  Coptic literary and monastic texts, the core of Coptic SCRIPTORIUM, are essential for the study of the Bible, intellectual history, literary history, and religious history.  The manuscripts containing these texts were removed from Egypt in the seventeenth through nineteenth centuries piece by piece (sometimes page by page).  Some have been published, many have not, and very few have been digitized in a format suitable for digital and computational work.  Texts must be must be reconstructed from pieces of manuscripts published in fragments and/or stored in various libraries and museums worldwide. The status of Coptic literary and monastic complicates metadata management and corpus architecture:  what constitutes a “work” – the codex in which a copy of the text appeared (and which may be dispersed across multiple physical repositories)? the manuscript fragment housed in a particular library or museum repository or the work, which only might survive in fragments of multiple codices (all copies of a “book” from the monastery’s library), and thus in fragments not only from more than one codex but also more than one modern repository?

Coptic scholarship still lacks many standards for digital publication and language research that are taken for granted in Greek and Latin. As with other ancient languages, Coptic manuscripts are written without spaces.  However, in contrast to its ancient counterparts, scholarly conventions on word division differ substantially from scholar to scholar.  Additionally, since Coptic is an agglutinative language, the relevant unit for linguistic analysis is the morpheme, below the ‘word’ level.  This means that segmentation guidelines must be developed for both levels of resolution. In order to search multiple texts, guidelines and tools for normalization, part-of-speech tagging and lemmatization of Coptic must be developed.  These tools need to take into account Coptic’s agglutinative nature, e.g. normalizing and annotating on the morpheme and word levels.

Finally, the development of the Coptic language during Egypt’s Greco-Roman era raises questions about the origins of the language, its usage in a multilingual context, and the language practices of its ancient speakers and writers.  Coptic consists of Egyptian grammar, vocabulary, and syntax written primarily in the Greek alphabet; some Egyptian letters were retained, and some Greek and Latin vocabulary was incorporated into the language.  The richness of the vocabulary’s languages of origin varies from author to author, genre to genre.  And despite recent publications on the topic, much research remains to be conducted on the extent and nature of multilingualism in late antique Egypt, especially during the fourth and fifth centuries.   Additionally, due to the agglutinative nature of the language, one word can be comprised of morphemes with different languages of origin.

This paper will focus on the automated tools our project is developing to process the language, especially tokenizing and part-of-speech annotations.  Coptic SCRIPTORIUM has developed the first tokenizer and part-of-speech tagger for the language, and in fact for any language in the Egyptian language family. The presentation will address the unique challenges to processing and annotating the Coptic language.  We will present our current technical solutions, their accuracy rates, and the potential for future research.  We will also address the ways in which this language’s and corpus’s unique featured differentiate them from other more widely studied ancient languages, such as Greek and Latin.  Examples will be drawn from the open-access corpora we are developing and annotating with these tools, available at http://coptic.pacific.edu (backup sitehttp://www.carrieschroeder.com/scriptorium).  The Coptic corpora processed and annotated with these tools can be searched and visualized in ANNIS, a tool for multi-layer annotated corpora.   We anticipate this presentation to be of interest to scholars in digital humanities working with ancient languages and manuscript corpora as well as DH linguists and corpus linguists.

References

  1. Bentley Layton, A Coptic Grammar, 3rd Edition, Rev, Porta Linguarum Orientalium Neue Serie 20 (Wiesbaden: Harrassowitz, 2011), 19–20.
  2. Layton, Coptic Grammar, 5.
  3. J. N. Adams, Mark Janse, and Simon Swain, Bilingualism in Ancient Society (Oxford: Oxford University Press, 2002); Arietta Papaconstantinou, ed., The Multilingual Experience in Egypt from the Ptolemies to the Abassids (Burlington: Ashgate, 2010).
  4. http://www.sfb632.uni-potsdam.de/annis/


Tagging Shenoute

By Caroline T. Schroeder & Amir Zeldes
Schroeder presented this paper at the annual meeting of the North American Patristics Society in Chicago, Illinois, on May 24, 2014.  This post is a very minimally edited version of the paper prepared for and delivered at the conference.
Creative Commons License
Tagging Shenoute by Caroline T. Schroeder & Amir Zeldes is licensed under a Creative Commons Attribution-NonCommercial-ShareAlike 4.0 International License. Tagging Shenoute

Many thanks to the people and institutions who made this possible: my collaborator Dr. Amir Zeldes; Tito Orlandi, Stephen Emmel, Janet Timbie, and Rebecca Krawiec who have freely given their labor and their advice; and funding agencies of the National Endowment for the Humanities and the German Federal Ministry of Education and Research. I’m also pleased that this year Rebecca Krawiec along with Christine Luckritz Marquis and Elizabeth Platte will be helping to expand our corpus of digitized texts.

Two years ago, I gave a NAPS paper entitled, “Shenoute of Atripe on the Digital Frontier,” in which I explored – and despaired – of challenges to digital scholarship in early Christian studies, especially Coptic. I posed important questions, such as, “Why don’t my web pages make the supralinear strokes in Coptic appear properly?” and “Why do I only have 50 followers on Twitter?”

I am pleased to report that I have in fact solved both of those problems. And today I want to take you on a tour into the weeds of digital Coptic: how to create a data model for computational research in Coptic; the requirements for visualizing and searching the data; and what you can do with this all once you’ve got it.

Today I’m going to get technical, because over these past two years I’ve come to learn two things:

1. Digital scholarship is about community—the community that creates the data, contributes to the development of standards for the creation of that data, and conducts research using the data. In other words, my work won’t succeed if I don’t drag all of you along with me.

2. The truth is not in there (i.e., you might be thinking, “What is she doing talking about “data” – she did her Ph.D. at Duke in the 1990s?!). In case you came to this paper wondering if I’ve abandoned my Duke Ph.D. post-modern, Foucauldian, patented Liz Clark student cred for some kind of positivist, quantitative stealth takeover of the humanities, well HAVE NO FEAR. The true truth is not in some essentialized compilation of “the data.” As with traditional scholarship, our research questions determine how we create our dataset, and how we curate it, annotate it is already an act of interpretation.  (I owe Anke Lüdeling for helping me think through this issue.)

So please, take my hand and take the red pill, not the blue pill, and jump into the data.

Slide03

Our project is called Coptic Scriptorium, and in a nutshell, it is designed as an interdisciplinary, digital research environment for the study of Coptic language and literature. We are creating technologies to process the language, a richly annotated database of texts formatted in part with these technologies, texts to read online or download, documentation, and ultimately a collaborative platform where scholars and students will be able to study, contribute, and annotate texts. It is open source and open access (mostly CC-BY, meaning that you can download, reuse, remix, edit, research, and publish the material freely as long as you credit the project.

We also invite any of you to collaborate with us. Consider this presentation an open invitation. Our test case was a letter of Shenoute entitled Abraham Our Father, and we’ve since expanded to include another unnamed text by Shenoute (known as Acephalous Work 22 or hereafter A22), some Sahidic Sayings of the Desert Fathers, two letters of Besa, and a few chapters of the Gospel of Mark.

I’ve entitled this paper, “Tagging Shenoute” for two reasons. First, “tagging” refers to the process of annotating a text. To conduct any kind of search or computational work on a corpus of documents, you need to mark them up with annotations, sometimes called “tags.” They might be as simple as tagging an entire document as being authored by Shenoute, or as complex as tagging every word for its part of speech (noun, verb, article, etc.) or its lemma (the dictionary headword for words that have multiple word forms) Second, because the pun with the child’s game of tag was too rich to pass up. The Abba himself disdained children’s play and admonished the caretakers of children in his monastery not to goof around:

As for some people who have children who were entrusted to their care, if it is of no concern to them that they live self-indulgently, joking with them, and sporting with them, they will be removed from this task. For they are not fit to be entrusted with children. It is in this way also with women who have girls given to them.”

Shenoute, Canons vol. 9, DF 186-87 in Leipoldt 4:105-6

And finally, I was inspired by a conversation between two senior Coptic linguists at the Rome 2012 Congress for the International Association of Coptic Studies. When I told them about our nascent project, one replied something along the lines of, “I would not dare to think that Shenoute would allow himself to be tagged!” And the riposte from the other: “And I would not presume to speak for Shenoute!” All of this is to subversively suggest, that despite Shenoute’s own words, he can be fun. While annotation is serious work, there is also an element of play: playing with the data, and pleasure in the text.

The premise of our project is to facilitate interdisciplinary research, to develop a digital environment that will be of use to philologists, historians, linguists, biblical scholars, even paleographers. To that end, we have dared to tag Shenoute in quite a variety of ways:

  • Metadata: information about text, author, dating, history of the manuscript, etc.
  • Manuscript or document structure: page breaks, column breaks, line breaks, damage to the manuscript, different ink colors used, text written as superscript or subscript, text written in a different hand….
  • Linguistic: part of speech (noun, verb, article, stative verb, relative converter, negative prefix, etc.), language of origin (Greek, Hebrew, Latin…), lemmas (dictionary headwords for words with multiple forms
  • Translations

With hopefully more to come: biblical citations, citations and quotations to other authors, named entities with data linked to other open source projects on antiquity, source language for texts in Coptic translation (e.g., Apophthegmata Patrum and Bible).

We also must be cautious and discerning, on the lookout for the demon of all things shiny and new. As Hugh Cayless writes on the blog for the prosopographical project SNAPDRGN,

“In any digital project there is always a temptation to plan for and build things that you think you may need later, or that might be nice to have, or that might help address questions that you don’t want to answer now, but might in the future. This temptation is almost always to be fought against. This is hard.”

Hugh Cayless, “You Aren’t Gonna Need It” 22 May 2014

Digital scholarship in Coptic must develop annotation standards in conversation with existing conventions in traditional, print scholarship, as well as digital standards used by similar projects on the ancient world and ancient texts. For Shenoute, this means using as titles of texts the incipits delineated by Stephen Emmel in his book Shenoute’s Literary Corpus, manuscript sigla developed by Tito Orlandi and the Corpus dei Manoscritti Copti Letterari as well as id numbers for manuscripts established by the online portal Trismegistos, and part-of-speech tags based on Bentley Layton’s Coptic Grammar.

In the digital world, in addition to Trismegistos, the emerging standard for encoding manuscript information for ancient papyri, inscriptions, and manuscripts is the subset of the Text Encoding Initiative’s XML tagset known as EpiDoc. The Text Encoding Initiative is a global consortium of scholars who have established annotation standards (including a comprehensive set of tags) for marking up text for machine readability. XML stands for Extensible Markup Language, and is used more widely in computer science, including in commercial software. EpiDoc is a subset of TEI annotations used especially by people working in epigraphy or on ancient manuscripts in a variety of languages.  Patristics scholars might be familiar with it because the papyrological portal papyri.info uses EpiDoc markup to annotate its digital corpus.

So, this is a lot of information – what does the data actually look like? Coptic poses some unique challenges.

Slide12

To get from base text, to annotated corpora, there are a lot of steps: basic digitization of the text, encoding the manuscript information, ensuring Coptic word forms make sense properly, separating those bound groups into morphemes, normalizing the spelling so you can do genuine searching, and tagging for various annotations. I’m going to briefly go through most of these issues.

Before you can even begin to think about tagging, the data must be in a digital format that can be used and searched: typed in Unicode (UTF8) characters and in recognizable word forms. Many of us in this room probably have various files on our computers with text we keyed into Microsoft Word (or dare I say, WordPerfect?) in legacy fonts. We have developed converters ourselves for a couple of different legacy fonts. But keying in the text is only one piece of the puzzle; users of the data must be able to see the characters on their computers, ideally even if they don’t have a Coptic font or keyboard installed, or on their mobile devices.

Slide11

So we created an embedded webfont that is installed on our website and inside our search and visualization tool. We’ve even embedded a little Coptic keyboard into the search tool, so that you can key in Coptic characters yourself if your device isn’t capable.

Those of you who have studied Coptic know that it is different from Greek or Latin, in that it is an agglutinative language.

Slide13

Multiple different morphemes, each with different parts of speech, are plugged together like Legos to create “words,” or as Layton describes them, “bound groups.” When you search Coptic, you might not want to search bound groups but rather the individual morphemes within them. That means, when you digitize the text, you need to be attentive to the morphemes and word segmentation. This process of breaking a text into its constituent parts is called “tokenization”; the token is the smallest possible piece of data you annotate. In English texts, it’s often a word.

There are two problems with Coptic.

–      First, the concept of words is complex in Coptic

–      Second, annotations overlap parts of words. For example, in a manuscript a line might break in the middle of a word.

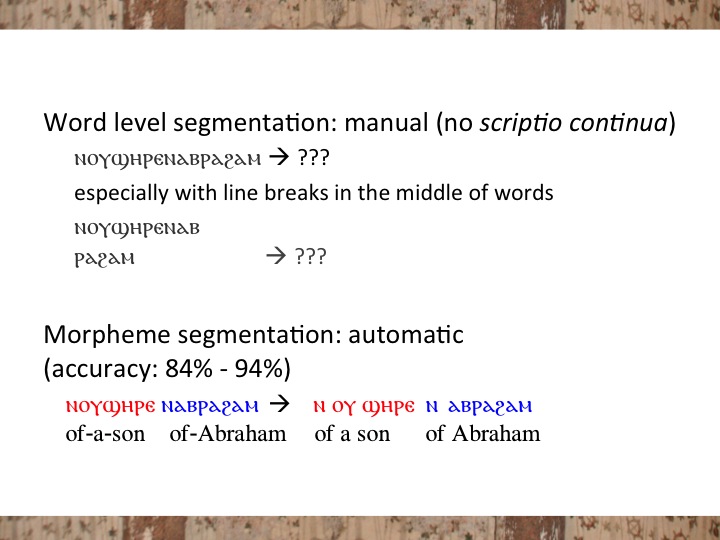
Here are some examples.  When we say Coptic is agglutinative, we mean that what we might think of as “words” are really bound groups of morphemes, as seen here in these two examples.

Slide14We’ve color-coded each separate morpheme, so that you can see that each one of these examples is a combination of seven or eight components.   To complicate matters, scholars use different conventions to bind these morphemes into words in print editions.  We follow Layton’s guidelines for visualizing or rendering Coptic bound groups.

But we also need not only to see or visualize words as bound groups but also to automate the taking apart of these bound groups. Our tools cannot yet handle text as you might see it in a manuscript, with scriptio continuaSlide15But, we have automated segmenting bound groups into morphemes, thanks in part to a lexicon that Tito Orlandi graciously gave us, which sped up our work by about a year.

But we need to dig deeper into our data than morphemes, because we might need to annotate on a level that’s even smaller than the morpheme. If you want to mark up the structure of the manuscript – the line breaks, oversized letters, letters written in different ink colors, etc., you need to annotate on the level of parts of morphemes or individual letters.

Slide16As in this example, where things that appear in the middle of a morpheme (such as the oversized janja in the middle of the word pejaf) might need to be tagged – size, line break, etc. So you need to annotate on a more granular level than “words” or “morphemes.”

So, now we’ve already got a ton of different ways to tag our data, and we’re not done yet. Lots of other tagging or annotations that you might want to make and use for research.  What you do NOT what to have to do is to write this all up manually using actual xml tags in what is called inline markup.

Slide17

Instead if you markup your data in multiple layers, or what is known as mulit-layer standoff markup, you can make more sense of it and tag your data much more easily.

Slide18Here you can see the smallest level of data, the token layer, at the top. The second layer shows the morpheme segments, aligned with the tokens but those two at the end are merged into one, because it is one term – Abraham. Line three gives you the bound groups, line four shows you line breaks. Here you see the line ends in the middle of Abraham. Line 5 shows column breaks, and six page breaks.

Moreover, you want to automate as much of your annotation as possible. We have at least semi-automated normalizing spelling, which eliminates diacritics and supralinear strokes, normalizes spelling variants, deals with abbreviations, and so forth. Normalization is essential both for search and for further automated annotations.  We’ve also semi-automated annotations for language of origin of words in a text, and we are developing a lemmatizer, which will match each word with its dictionary head word.

Finally we’ve developed a part of speech tagger, which is is a natural language processing algorithm. It learns as it processes more data, based on patterns and probabilities. We have two sets of tags – coarse, which will just tag all nouns as nouns, for example – and fine – which will tag proper nouns, personal subject pronouns, personal object pronouns, etc.

Slide20 And so now your data looks like this:

Slide21You’ve preserved all your information. By making everything annotations – even spelling normalization – you don’t “lose” information. You just annotate another layer.

So, what can you do with this?

1. Basic search for historical and philological research. Below is a screen shot of the search and visualization tool we are using, ANNIS.  ANNIS was developed originally for computational linguistics work, and we are adapting it for our multidisciplinary endeavor. Here I’ve searched for both the terms God and Lord in Shenoute’s Abraham Our Father.

Slide23The query is on the upper left, corpus I’ve selected is in the lower left, and the results on the right.

You can export your results or select more than one text to search:

Slide24And if you click on a little plus sign next to “annotations” under any search result, you can see all the annotations for that result.

Slide25So, noute is a noun, it’s part of this bound group hitmpnoute, it’s in page 518 of manuscript YA, etc.

You can also read the text normalized or in the diplomatic edition of the manuscript inside ANNIS:
Slide26
Or if you already know the texts you want to read, you can access them easily as stand-alone webpages on our main site (coptic.pacific.edu:  see the HTML normalized and diplomatic pages of texts).

2. Linguistics and Style.  Here, I’ve told ANNIS to give me all the combinations of three parts of speech and the frequencies those sequences occur:

Slide27

This is known as a “tri-gram” – you’re looking for sequences of three things. I didn’t tell it any particular three parts of speech, I said, give me ALL sequences of three. And then I generated the frequencies. Note: everything I am presenting here is raw data, designed primarily to GENERATE and EXPLORE research questions, not to answer them in a statistically rigorous way. This is raw data.

What do we learn?

The most common combination of three grammatical categories is the preposition + article + noun (“in the house”) across ALL the corpora – this is #1. Not a surprise if you think about it.

Slide29Also, you’ll notice some distinct differences in genre: the second most common tri-gram in the Apophthegmata Patrum is the Past tense marker+the subject personal pronoun+verb –this fits with the Sayings as a kind of narrative piece (3.66% of all combinations). Similarly, for Mark 1-6– the second most common tri-gram is Past tense marker +personal pronoun subject + verb (4.03% of trigrams). Compare that to Besa, where this combination is the 4th most common tri-gram (2.1% of trigrams), or Shenoute, with .91% (A22, 14th most common trigram) & 1.52% (also 4th most common) in Abraham Our Father. (My hunch is this tri-gram probably skews HIGH in Abraham compared to its frequency overall in Shenoute, since there are so many narrative references to biblical events in Abraham Our Father.)

Whereas a marker for Shenoute’s style is the relative clause.  Article + noun + relative converter occurs .91% of the time in Acephelous Work #22 and .76% in Abraham. But in Mark, it’s the 33rd most common combination, and occurs .55% of the time. In the Apophthegmata Patrum, it occurs .44% of the time (the 40th most common combination).

Slide30 Some of you are probably thinking, “Wait a minute, what is this quantitative analysis telling me that I don’t already know. Of course narrative texts use the past tense! And Shenoute’s relative clauses have been giving me conniption fits for years!”  But actually, having data confirm things we already know at this stage of the project is a good thing – it suggests that we might be on the right track. And then with larger dataset and better statistics, we can next ask other questions about, say, authorship, and bilingualism or translation vs native speakers.  For example:  A) How much of the variation between Mark and the AP on the one hand, and Shenoute and Besa on the other can be explained by the fact that Mark and the AP are translations from the Greek? Can understanding this phenomenon – the syntax of a translated text – help us study other texts for which we only have a Coptic witness and resolve any of those “probably translated from the Greek” questions arise about texts that survive only in Coptic? B) Shenoute is reported to have lived for over 100 years with a vast literary legacy that spans some eight decades. Did he really write everything attributed to him in those White Monastery codices? Can we use vocabulary frequency and style to attribute authorship to Coptic texts?

3. Language, loan words, and translation practices.  We can also study loan words and translation practices. Quickly let’s take a look at the frequency of Greek loan words in the five sets of texts:

Slide31In Abraham Our Father, 4.71% of words are Greek; Mark 1-6: 6.33%; A22: 5.44%; Besa: 5.82%; AP: 4.25%.  The texts are grouped on the graph roughly by the size of the corpus – Mark 1-6 is closer in size to Abraham Our Father, and the others are very small corpora. What’s interesting to me is the Apophthegmata Patrum number.  Since it’s a translation text, I’d expect this figure to be higher, more like Mark 1-6.

4.  Scriptural references and other text reuse.  Is it also possible to use vocabulary frequencies to find scriptural citations? The Tesserae project in Buffalo is working on algorithms to compare two texts in Latin or two texts in Greek to try to identify places where one text cites the other. Hopefully, we will be able to adapt this for Coptic one day.

Slide32
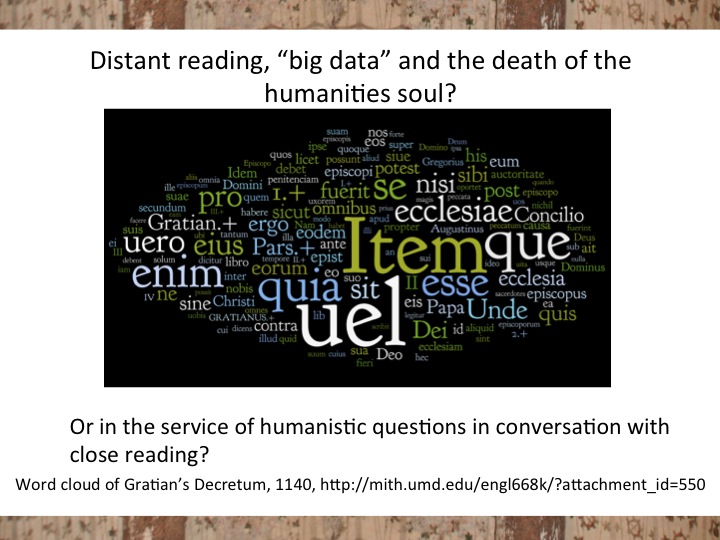
In the Digital Humanities, “distant reading” has become a hot topic. Distant reading typically means mining “big data” (large data sets with lots and lots of texts) for patterns. Some humanists have bemoaned this practice as part of the technological takeover of literary studies, the abandonment of close reading in favor of quantitative analyses that don’t require you ever to actually read a text. Can distant reading also serve some very traditional research questions about biblical quotations, authorship identification, prosopography, or the evolution of a dialect?

This project still has a lot to do. We need to improve some of our taggers, create our lemmatizer, link our lemmas to a lexicon, provide universal references so that our texts, translations, and annotations can be cited, and possibly connect with other linked data projects about the ancient world (such as Pelagios and SNAPDRGN).

For today, I hope to have shown you the potential for such work, the need for at least some of us to dive into the matrix of technical data as willingly and as deeply as we dive into depths of theology and history. And also, I invite you to join us. If you have Coptic material you’d like to digitize, if you have suggestions, if you would like to translate or annotate a text we already have digitized, consider this an invitation. Thank you.

Slide33

2 NEH Grants to support Coptic SCRIPTORIUM

The Coptic SCRIPTORIUM project is pleased to announce that we have been awarded two grants from the National Endowment for the Humanities.  A grant from the Office of Digital Humanities will support tools and technology for the study of Coptic language and literature in a digital and computational environment.  A grant from the Division of Preservation and Access will support digitization of Coptic texts.

neh_logo

Press Release from the University of the Pacific:

Academics

Dr. Caroline T. Schroeder Receives two National Endowment for the Humanities grants

Ann MazzaferroApr 8, 2014

Google has transformed the way we seek knowledge, and most questions can be answered with, “There’s an app for that,” but there are still corners that no search engine or web application have yet reached, among them rare writings in a dead Egyptian language.

With $100,000 in new grants from the National Endowment for the Humanities, Caroline T. Schroeder, associate professor of Religious and Classical Studies at University of the Pacific, plans to change that. Working in collaboration with her project co-director, Amir Zeldes of Humboldt University in Berlin, Schroeder’s goal is to make Coptic accounts of monks battling demons in the desert, early theological controversies, and accounts of life in Egypt’s first Christian monasteries as easy to access online as the morning’s latest news.

“Dr. Schroeder is a distinguished scholar and spectacular teacher, and there is no one more deserving of this prestigious recognition,” said Dr. Rena Fraden, dean of College of the Pacific, the liberal arts and sciences college at University of the Pacific. “Nations – ancient and modern – will always be judged for their contributions to knowledge and the arts. Pacific and Carrie Schroeder belong to this glorious tradition.”

Schroeder received a $40,000 Humanities Collections and Reference Resources grant, which will enable scholars not only to digitize core Coptic texts housed at institutions around the world, but to develop standards for future digitization projects. She also received $60,000 Digital Humanities Start-Up Grant; it will allow scholars to develop the tools and technologies necessary for computer-aided study and interaction with the materials.

The study of Coptic texts has gained attention in recent years, with high-profile controversies including the announcement in 2012 of an apparent Coptic papyrus text that may refer to “Jesus’ wife,” and increased international focus on the political climate of Egypt.

The digitization of these texts, and the database that Schroeder and her colleagues are working to create, will allow students, researchers, and non-academics alike to translate, analyze and understand the content of these Coptic texts, and to cross-reference the material with other texts and resources, including dictionaries and lexicons.

“This is the most cutting edge grant you can get for this type of work,” said Schroeder, who has taught at Pacific since 2007 and is the director of the Pacific Humanities Center. “This is about creating the technology for the study of the humanities. There aren’t that many technologies that work for Coptic or Egyptian texts. It’s an entire language family, and an important one for history, language, art. This is a world cultural heritage, a study of how our world and culture came to be.”

It will also create a centralized, open-source archive where these texts can be accessed in their entirety, anywhere in the world. This is particularly important, as many of these texts have been separated over centuries; reading one letter penned by a Coptic author may mean traveling to several different libraries and museums across the globe to track down the full account. While some Coptic manuscripts have been published in print, others have not.

“There are a lot of materials from this time and place that need more study. You have to know, if you want to read a letter, that some of the pages are going to be in London, some in Naples, some in Paris,” Schroeder said. “These documents and texts are primarily housed in Western museums and libraries, and our project is committed to being open-access, and to being available to everyone, including people in the country where these texts originated.”

This multi-disciplinary project has involved work with scholars from around the world, as well as collaboration among faculty and students at Pacific. Lauren McDermott, an English major with a Classics minor in the College, learned the Coptic alphabet in order to help proofread, digitize, and encode texts; Alexander Dickerson, a Computer Sciences major in the School of Engineering and Computer Sciences, worked on the coding as well.

RS43926_Carrie Schroeder 1

About the National Endowment for the Humanities
Created in 1965 as an independent federal agency, the NEH supports research and learning in history, literature, philosophy, and other areas of the humanities by funding selected, peer-reviewed proposals from around the nation. For more information, visit www.neh.gov.

About University of the Pacific
Established in 1851 as the first university in California, University of the Pacific prepares students for professional and personal success through rigorous academics, small classes, and a supportive and engaging culture. Widely recognized as one of the most beautiful private university campuses in the West, the Stockton campus offers more than 80 undergraduate majors in arts and sciences, music, business, education, engineering and computer science, and pharmacy and health sciences. The university’s distinctive Northern California footprint also includes the acclaimed Arthur A. Dugoni School of Dentistry in San Francisco and the McGeorge School of Law in Sacramento. For more information, visit www.pacific.edu.

March 2014 Coptic SCRIPTORIUM Release notes

Coptic SCRIPTORIUM is pleased to announce a new release of data and an update on our project.  Please visit our site at coptic.pacific.edu (backup at www.carrieschroeder.com/scriptorium).

We’ve released several new corpora:
-two fragments of Shenoute’s Acephelous Work #22 (aka A22, from Canons Vol. 3)
-two letters of Besa (to Aphthonia and to Thieving Nuns)
-chapters 1-6 of the Sahidic Gospel of Mark (based on Warren Wells’ Sahidica New Testament)

These corpora include:
⁃    visualizations and annotations of diplomatic manuscript transcriptions (except for Mark)
⁃    visualizations and annotations of the normalized text
⁃    annotations of the English translation (except for some A22 material)
⁃    part-of-speech annotations (which can be searched)
⁃    search and visualization capabilities for normalized text, Coptic morphemes, and bound groups in most of the corpora
⁃    Language of origin annotations (Greek, Hebrew, Latin) in most corpora (which can be searched)
⁃    TEI XML files of the texts in the corpora, which validate to the EpiDoc subset

We’ve also:
⁃    Updated the documentation about our part-of-speech tag set and tagging script.  (If you’re interested at all in Coptic linguistics please do read about our tag set)
⁃    Provided some example queries for our search and visualization tool (ANNIS); just click on a query and ANNIS will open and run it
⁃    updated our Frequently Asked Questions document
⁃    released an update to the Apophthegmata Patrum corpus to incorporate some of the new technologies described above
⁃    improved automation of normalizing text, annotating it for part-of-speech, annotating language of origin, annotating word segmentation (bound groups vs morphemes, etc.)

We would love to hear from you if you use our site; we think it will be useful for people teaching Coptic as well as conducting research.  Please email either of us feedback directly.

The improvements in automation also mean we would love to work with you if you have digitized Coptic texts that you would like to be able to search or annotate, if there are texts you would like to digitize, or if you would like to annotate existing texts in our corpus in new ways.  We are ready to scale up!

Thanks for all of your support.  This project is designed for the use of the entire Coptological community, as well as folks in Linguistics, Classics, and related fields.

January 2014 Coptic SCRIPTORIUM release notes

We’ve released some additional TEI XML files for our SCRIPTORIUM corpora at http://coptic.pacific.edu (backup site http://www.carrieschroeder.com/scriptorium).

  • All the TEI files have been lightly annotated with linguistic annotations.
  • The metadata has been updated to provide more information about the repositories and manuscript fragments.
  • There are now TEI downloads for every file in our public ANNIS database.
  • All TEI files conform to the EpiDoc TEI XML subset and validate to the EpiDoc schema.
  • The files are licensed under a CC-BY 3.0 license which allows unrestricted reuse and remixing as long as the source is credited (Coptic SCRIPTORIUM).  Linguistic annotations were made possible with the sharing of resources from Dr. Tito Orlandi and the CMCL (Corpus dei Manoscritti Copti Letterari); please credit them, as well.

We welcome your feedback on the TEI XML.  We hope to release more texts in the corpora later this winter or in early spring.


SBL presentation on Digital Technologies to find and study biblical references in Coptic literature

The slides from my 2013 Society of Biblical Literature presentation are now available on Academia.edu and are referenced on Coptic SCRIPTORIUM’s Zotero Group Library page.

Searching for Scripture: Digital Tools for Detecting and Studying the Re-use of Biblical Texts in Coptic Literature (Caroline T. Schroeder, Amir Zeldes)

Abstract

Some of our most important biblical manuscripts and extra-canonical early Christian literature survive in the Coptic language. Coptic writers are also some of our most important sources for early scriptural quotation and exegesis. This presentation will introduce the prototype for a new online platform for digital and computational research in Coptic, and demonstrate its potential for the detection and analysis of “text-reuse” (quotations from, citations and re-workings of, and allusions to prior texts). The prototype platform will include tools for formatting digital Coptic text as well as a digital corpus of select texts (most specifically the writings of Shenoute of Atripe, who is known for both his biblical citations and his biblical style of writing). It will allow searching for patterns of shared vocabulary with biblical texts as well as for grammatical and syntactical information useful for stylistic analyses. Both the potential uses and imitations of implicit methodologies will be discussed.

New grant funded for Coptic digital studies

The German Federal Ministry of Education and Research (BMBF) has approved Dr. Amir Zeldes’ (Humboldt University) proposal for a young researcher group on Digital Humanities at HU Berlin, starting early next year. The project is called KOMeT (Korpuslinguistische Methoden für eHumanities mit TEI), and aims to apply corpus linguistics methods to ancient texts encoded in TEI XML, focusing initially on richly annotated corpora of Sahidic Coptic. Dissertations within the group will be mentored by Frank Kammerzell, Anke Lüdeling, Laurent Romary and myself.

The group will cooperate with the SCRIPTORIUM project that Dr. Zeldes and I presented at our workshop in Berlin in May.

(The text of this announcement is taken from Amir Zeldes’.)